
Case Study: Turning Supply Chain Data into Actionable Insights
Designing data-rich dashboards that help supply chain teams interpret inventory data and make faster, more informed operational decisions.
Users: Supply Chain Analysts, Inventory Managers, and Operations Teams responsible for monitoring and managing inventory across internal and third-party storage facilities.
Focus: Data visualization, workflow design, and decision-support systems that transform complex supply chain data into clear, actionable insights.
Overview
Supply chain teams relied on “Outside Storage Data” to manage inventory stored in third-party facilities, but existing tools made it difficult to understand how the data supported day-to-day decision-making.
I led UX research and design to uncover how different roles used this data and designed dashboard concepts that transformed complex inventory information into clear, actionable insights for analysts and inventory managers.
Role
UX Designer, UX Researcher, UX Team Lead
Tools
Figma, Mural, ChatGPT
Skills
UX Research, Data Visualization, Workflow Design, Information Architecture
Problem
Supply chain analysts and inventory managers lacked clear visibility into inventory stored at external facilities, making it difficult to interpret data and act on it efficiently.
Key challenges included:
- Limited understanding of how outside storage data was used across roles
- Difficulty interpreting large, complex datasets
- Fragmented workflows across multiple systems
- Lack of clear visualizations to support decision-making

Key Insight: Data Without Context Slows Decision-Making
Users had access to large amounts of data—but lacked the structure, context, and prioritization needed to make decisions quickly and confidently.


Research & Insights
I conducted user interviews, workflow analysis, and data synthesis to understand how supply chain teams interact with outside storage data.
Key insights:
1. Different roles require different levels of detail
Analysts, inventory managers, and operations teams needed tailored views based on their responsibilities.
2. Data lacked hierarchy and prioritization
Users struggled to quickly identify critical signals within dense datasets.
3. Decision-making depends on context
Users needed to understand not just what the data showed, but why it mattered—including cost impact, spoilage risk, and inventory movement.
Persona

Design Approach
I focused on transforming raw supply chain data into structured, decision-support interfaces.
Key principles:
- Make complex data scannable and hierarchical
- Support drill-down from summary to detail
- Align dashboards with real user workflows
- Surface critical signals (risk, cost, inventory status)

Design Process
- Conducted user interviews and workflow mapping
- Developed personas and use cases
- Explored low-fidelity concepts in Figma
- Iterated based on feedback and validation
This ensured the solution aligned closely with real-world operational needs.
Early Exploration


These insights informed a design approach focused on clarity, hierarchy, and actionability—transforming passive data into an active decision-support system.
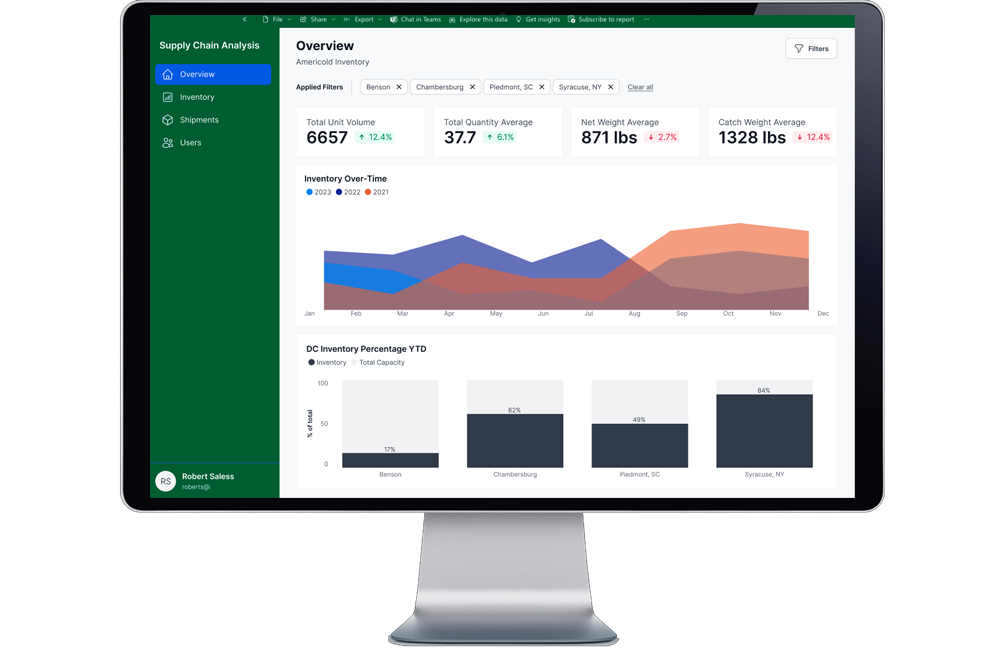
Solution: A Structured, Actionable Inventory Dashboard
Designed a dashboard system that enables users to monitor, interpret, and act on inventory data across external storage facilities within a unified workflow.
Designed a unified dashboard system that enables users to monitor, interpret, and act on inventory data across third-party storage facilities.


Drill-Down Workflows: From Summary to Detail
Introduced interactive drill-down tables that allow users to move seamlessly from high-level summaries to detailed inventory data.
This enables users to:
- investigate anomalies
- track inventory movement
- understand operational risks
Contextual Signals & Alerts
Surfacing What Matters Most
Designed signals and alerts to highlight critical issues, including:
- expiration risks
- stock level changes
- storage condition requirements
These signals help users prioritize actions and respond quickly.
Outcome
The redesigned approach improved how teams interpret and act on supply chain data:
- Enabled clearer visibility into external inventory.
- Enabled faster, more confident decision-making by making critical inventory signals immediately visible.
- Reduced cognitive load by structuring complex datasets into scannable, prioritized views.
- Streamlined inventory management workflows by consolidating fragmented data into a unified interface.
This work transformed supply chain reporting from passive data consumption into an active, decision-support system.