Thryv Reporting Research
1. Project Overview
Role: Senior UX/UI Designer & Research Lead
Product: Reporting Center — Email Performance & Leads Reports
Objective: Build a scalable UX testing process, improve comprehension of key metrics, and create system-level patterns that support digital performance and cross-team workflows.
This project demonstrates my ability to connect UX research with digital marketing goals, content strategy, SEO intent, and design system governance.
2. Problem
Business owners relied on reporting dashboards to understand performance and take action, but engagement and task completion were lower than expected.
Key issues included:
- Confusion around terminology and metric meaning
- Emotional frustration when data didn’t match expectations
- Dense layouts that created cognitive overload
- No comparison or trend context to support decision-making
- Lack of consistency across reporting modules
Core business challenge:
Users could access the data, but they couldn’t interpret it, trust it, or act on it, reducing product engagement and overall digital effectiveness.
This same issue commonly appears in healthcare journeys when content clarity or context is missing.
3. Research Goals
- Map emotional and behavioral friction in the reporting flow
- Identify patterns in how users interpret metrics and visuals
- Understand what increases trust vs. confusion
- Recommend design changes that improve clarity, comprehension, and action
- Establish a repeatable UX testing process scalable across multiple reporting features
4. Research Methodology
To create a testing process compatible with enterprise tools like UserZoom or MUIQ, I developed:
- Recruitment frameworks
- Test script templates
- Task-based evaluation modules
- A standardized synthesis model
Methods used:
- Moderated interviews (mental models, expectations)
- Unmoderated usability tests (navigation + comprehension)
- Thematic and emotional mapping
- Comparative needs assessment (trend vs. point-in-time data)
CMS alignment:
The insights were translated into CMS-friendly components that could work within Thryv’s templated layouts.
5. Key Insights
A. Emotional responses affected engagement
Unclear KPIs caused confusion, skepticism, and disengagement — similar to how unclear healthcare information impacts patient trust.
B. Information overload slowed decision-making
Layouts lacked hierarchy, forcing users to search for meaning.
C. Visuals improved comprehension and retention
Charts, icons, and summaries made key insights instantly clear.
D. Users needed context to make decisions
Trend lines, comparisons, and benchmarks were essential for interpreting performance.
E. Users needed actionable next steps
They wanted explanations and guided insights, not just raw data.
6. Design Recommendations
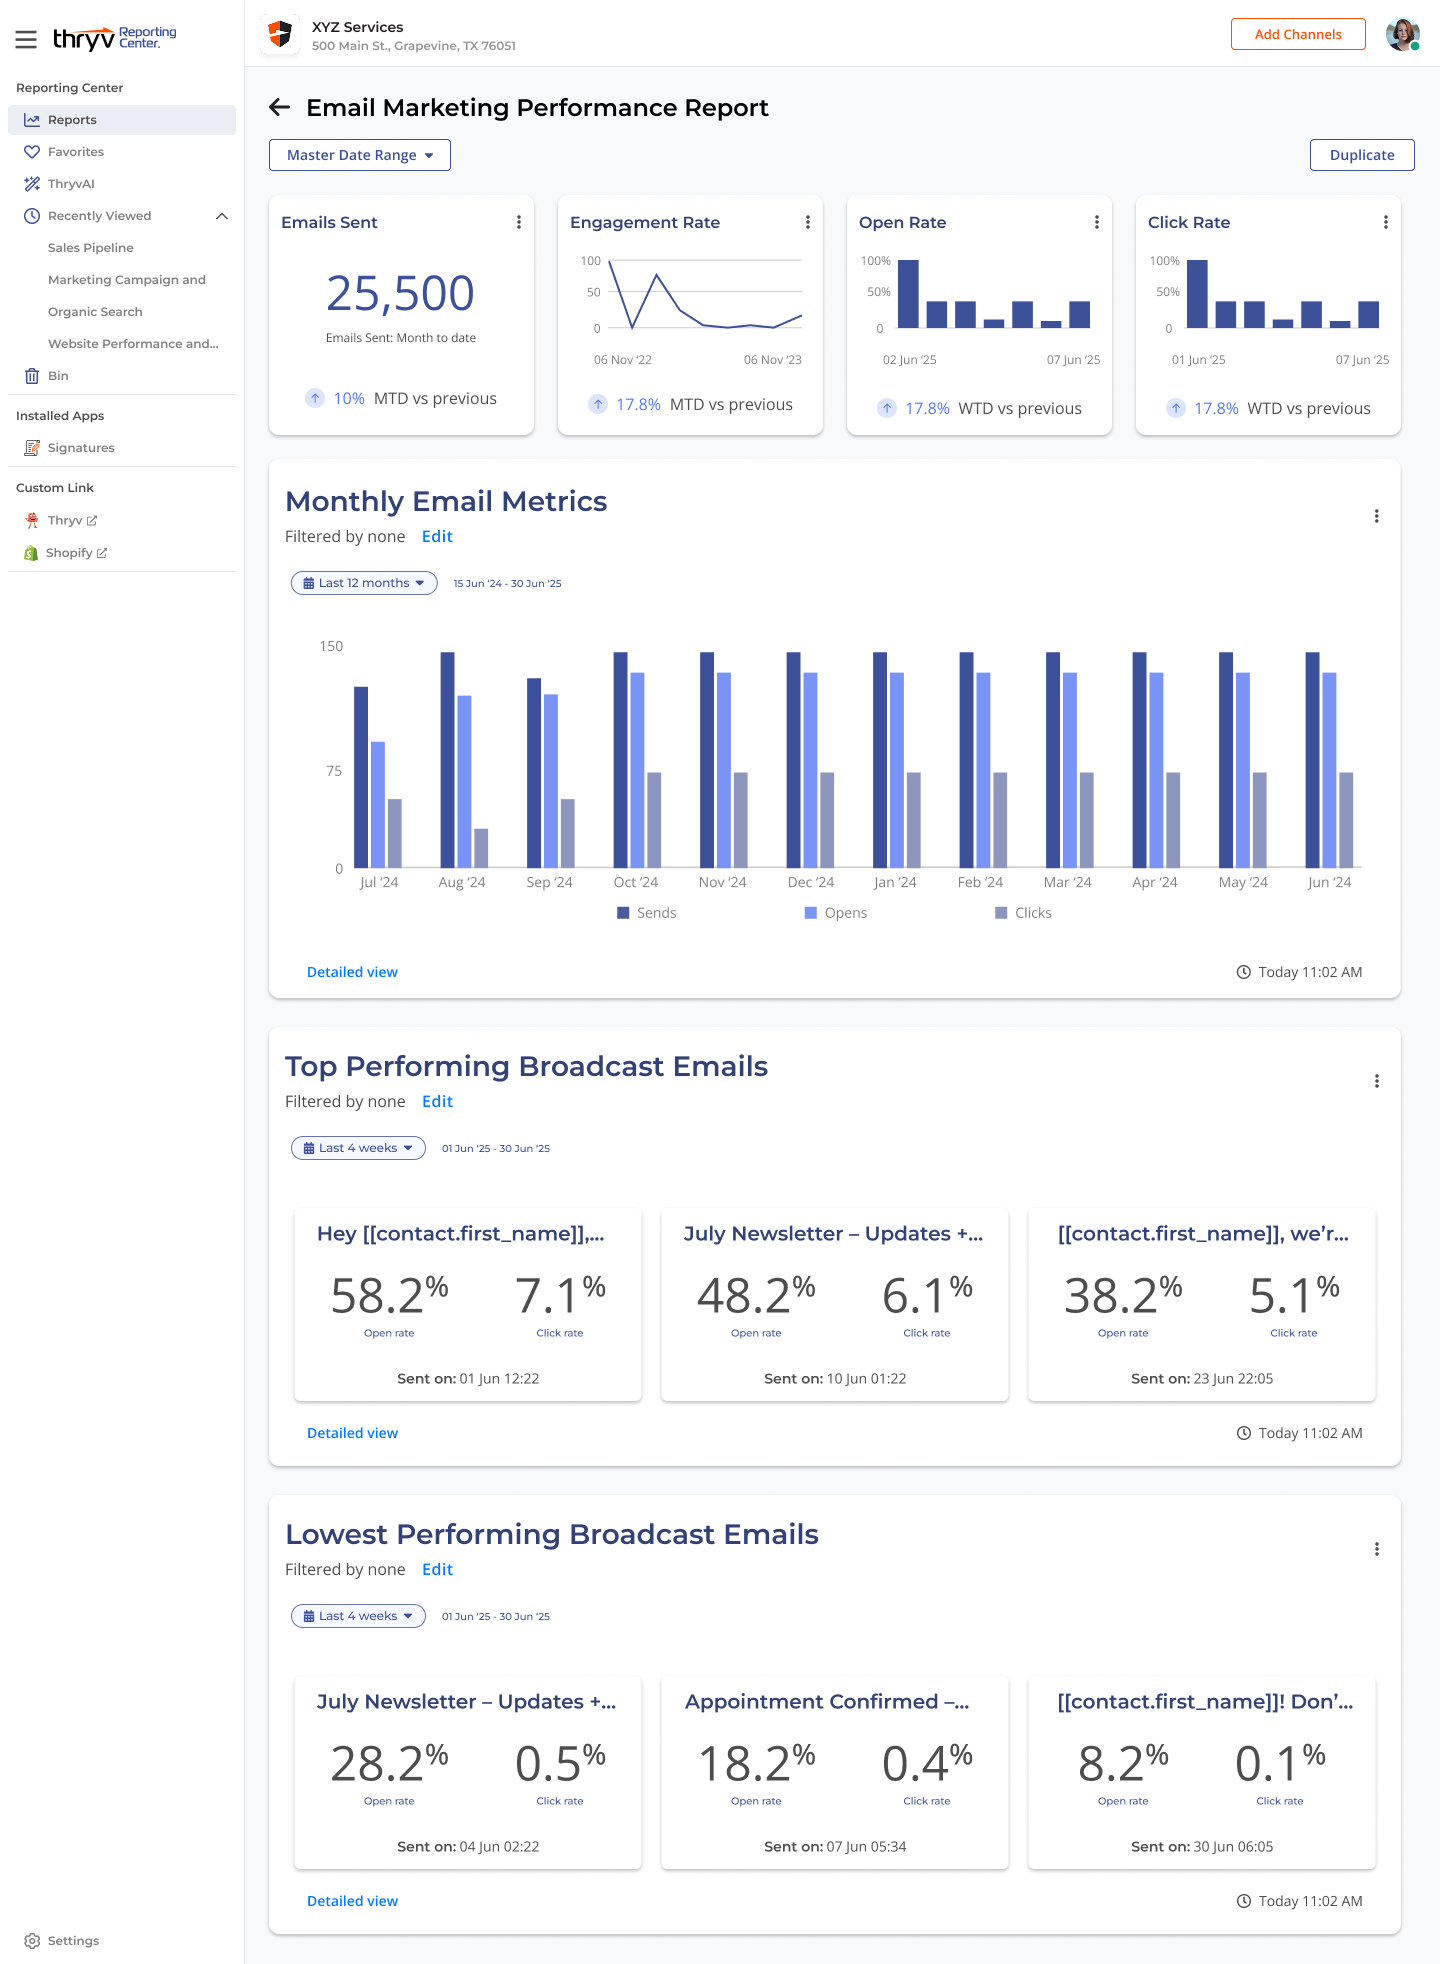
- Simplify layout and elevate visual hierarchy for faster scanning
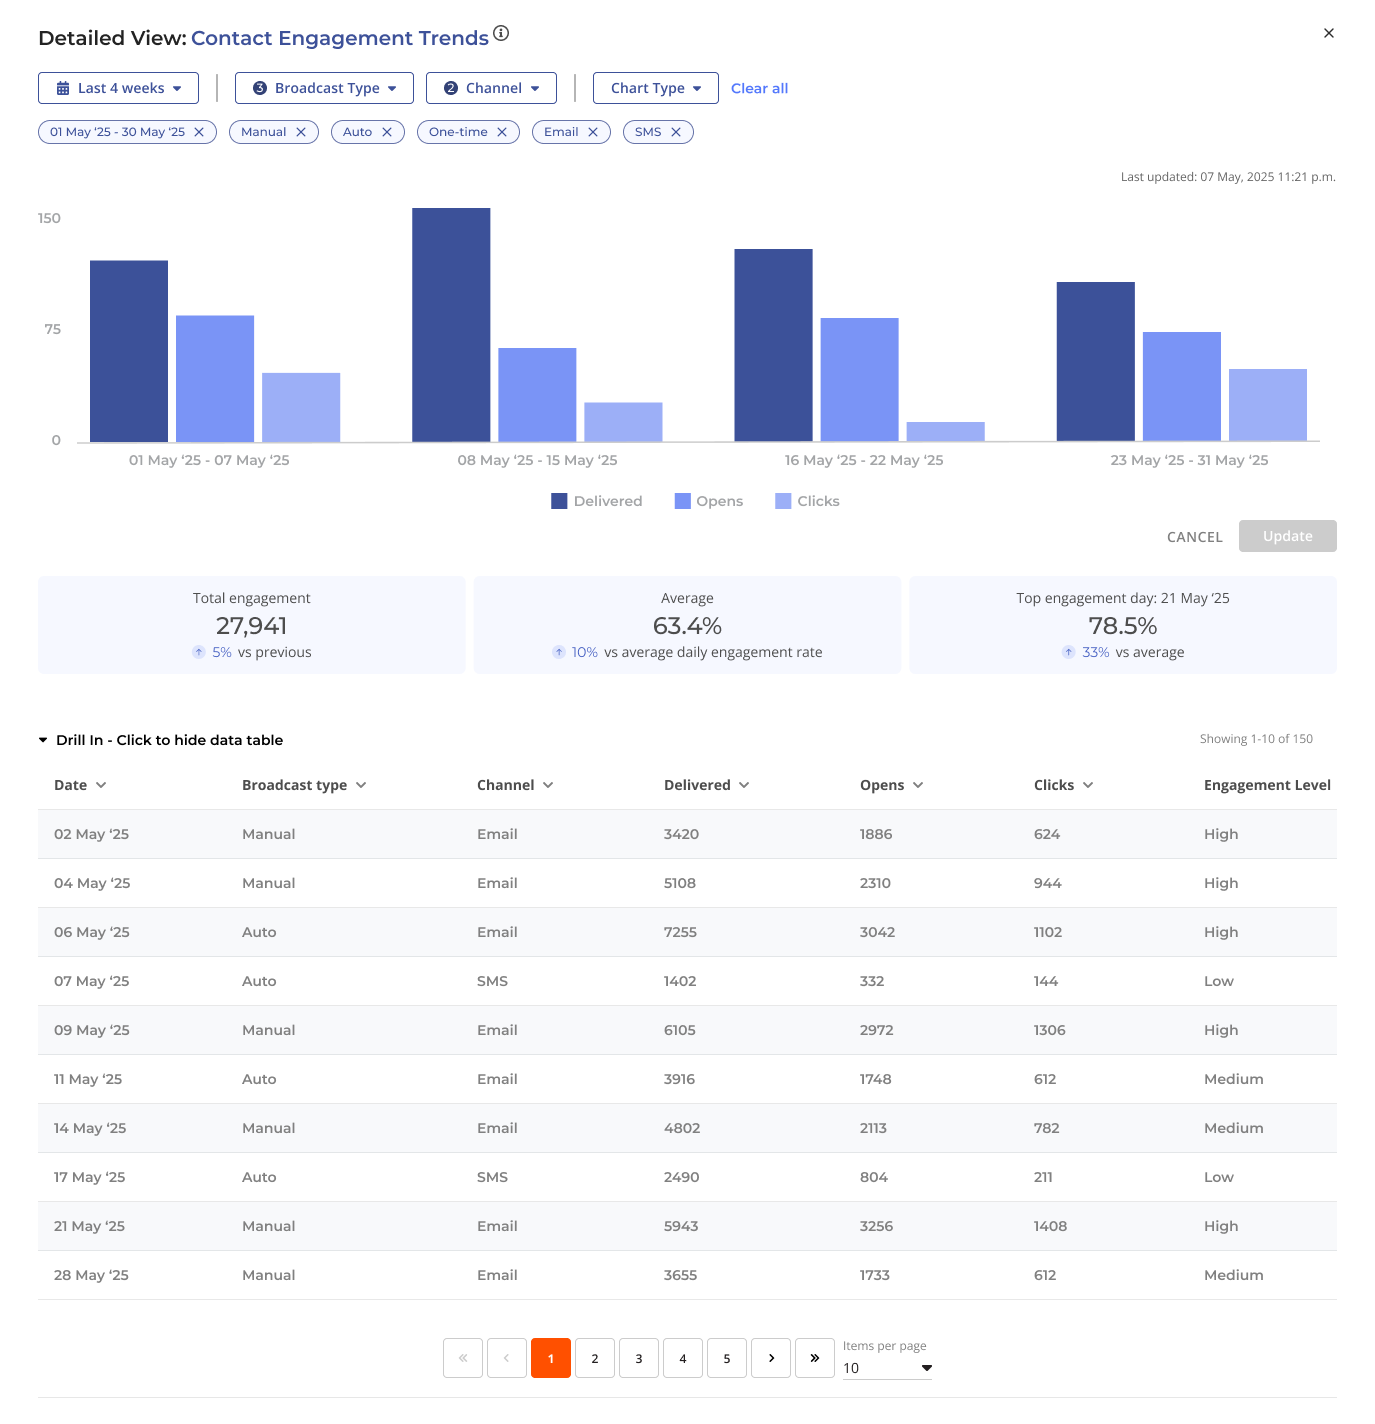
- Add YOY, MoM, and trend comparison tools
- Introduce hero metrics for immediate clarity
- Standardize chart components for consistent user experience
- Add tooltips, definitions, and guided explainers
- Integrate AI-assisted recommendations to support action
Impact on digital marketing:
These changes improved the clarity of content, reducing friction and aligning better with SEO intent, user journeys, and engagement patterns.
7. Design System Impact
The research directly informed the design system:
- A metric library ensuring consistent terminology and formatting
- A reusable hero metric and chart system for future dashboards
- Scalable, accessible data visualization patterns
- Cross-product guidelines that improved CMS efficiency and reduced design debt
8. Outcomes
- Increased comprehension of key metrics
- Reduced time-to-insight and cognitive load
- Improved navigation and re-engagement
- More trustworthy and actionable reporting experience
- Established a repeatable workflow: research → insights → design system integration
- Enabled cross-team alignment between UX, marketing, and engineering
Resources
Design Iterations based on user feedback